
Expert Iacopo Bertelli deep-dived into the topic of counterintuitive flows: when electricity is traded from a bidding zone with a high clearing price towards a bidding zone with a lower price. Iacopo takes us on board this phenomenon in this final analysis. Are you ready?
Counterintuitive Flows in 2023
Recently, counterintuitive flows (or adverse, or non-intuitive) have gained attention. Several instances of counterintuitive flows were observed on the Italy North bidding zone borders (link, link). The Core day-ahead flow-based market coupling regime (and the Nordic day-ahead flow-based market coupling regime which is currently being tested) deliver counterintuitive results now and then. Furthermore, for Viking Link (link) and, more broadly, interconnectors between Great Britain and the EU (and Norway), counterintuitive flows are of relevance as they signal inefficient allocation of cross-zonal capacities (link). The same applies to the Swiss bidding zone borders.
Hence, it felt like the right time to deep dive into the topic of counterintuitive flows.
Introduction
In the context of European electricity market integration, a counterintuitive flow is a (net) commercial exchange (or schedule) of electricity from a bidding zone with a high clearing price towards a bidding zone with a lower price. Such a flow is contrary to intuition (“counterintuitive”), as electricity should always be exported from low- to high-price bidding zones (also referred to as the “right economic direction”).
Counterintuitive flows can be challenging to understand for many stakeholders. The aim of this article is to shed some light on this phenomenon.
This article is divided into three parts:
- Introduce why counterintuitive flows result from market coupling
- Compare intuitive flows to counterintuitive ones
- Analyse counterintuitive flows based on 2023 data, including identification of trends and patterns by (type of) region
All data (day-ahead prices and scheduled commercial flows) were retrieved from the ENTSO-E transparency platform (link).
Before delving into explanations, let’s visualize what all the abbreviations for capacity calculation regions (CCRs) and bidding zones (BZs) in this article mean.

Figure 1: Left: Capacity Calculation Regions as of January 2024. Right: Bidding Zones as of January 2024. Note that SEM is expected to join the Core CCR following a decision from ACER expected for March 2024 (however, the Celtic Interconnector will not be operational until 2026/27). GB, CH, and RS are not part of SDAC but are mentioned in this article.
Some history of counterintuitive flows
When the market-coupling algorithm EUPHEMIA (link) was introduced in 2014, it was set to automatically reject counterintuitive flows. Following ACER decision 04/2020 (link), counterintuitive flows started being allowed with a patch in 2020, as they can result in greater overall socio-economic welfare. This change was triggered by studies (link) that showed how allowing counterintuitive flows would have generated, on average, an extra 18000 €/day of social welfare over the four years of the study (which comprised the CWE region: FR-BE-NL-DE-AT).
1. What is the origin of counterintuitive flows?
There are several reasons why counterintuitive flows can occur:
1. Explicit allocation: When cross-zonal capacity on a bidding-zone border is allocated via an explicit auction, traders bid for cross-zonal transmission capacity to allow the energy they (expect to) trade to be exchanged across the bidding-zone border. Essentially, they “bet” on the electricity price difference between the two bidding zones based on forecasts (of load, (renewable) generation, and ultimately day-ahead prices). The resulting (netted) schedule, after each transmission right holder has nominated the cross-zonal capacity it intends to utilize, might point in the wrong economic direction, i.e. from high-price to low-price areas. The bidding-zone borders where capacity is allocated via explicit auctions are those involving bidding zones not included in SDAC (e.g. CH, GB, RS). Let’s take a look at the case of Switzerland.

Figure 2: Counterintuitive flows on the Swiss borders on 01/01/2023 at 06:00 CET. DA prices (€/MWh) are in yellow. Intuitive flows (MW) are indicated by blue arrows and labels, counterintuitive flows in red. Flows not involving CH are lighter (red and blue).
In the figure above, CH has the lowest day-ahead (DA) price (-14€/MWh) compared to its neighbouring bidding zones but is (net) importing from FR, DE, and AT. This is not a “transit flow”, as CH is importing far more than it is exporting towards IT NORD. Note: IT NORD applies allocation constraints, but in this situation, they are not triggered (see next point to understand why this is relevant).
2. Allocation Constraints: Allocation constraints are limits to the amount of electricity that can be imported/exported on a certain (set of) bidding zone border(s) or an entire bidding zone (technically, the sum of imports and exports is called net position).

Figure 3: Counterintuitive flows on the Polish borders on 20/06/2023 at 14:00 CET. DA prices (€/MWh) are indicated in yellow. Intuitive (counterintuitive) flows (MW) are indicated by blue (red) arrows and labels. Flows not involving PL directly are shaded.
During the hour in the figure above, PL applied an allocation constraint of net zero imports (i.e., it could not be a net importer) on its SDAC bidding zone borders. As PL is importing 593 MW (more precisely, 593 MWh for one hour) from SE4, PL must export the same amount (252+231+69+41=593). This results in counterintuitive flows between PL and each of its Core neighbours DE, CZ and SK as well as LT, which shares an NTC bidding zone border with PL.
Allocation constraints are used by PL, Italy Nord (NORD in the figure below). In addition, SE3, NO1, NO2, DK1 use lineset constraints. While the used constraints have different names and purposes, they all affect the maximum imports/exports on a set of bidding zone borders (see table and figure).

Figure 4: Use of external constraints in SDAC.
3. Flow-based market coupling: An exchange from a high-priced bidding zone to a low-price one can occur if the generated welfare loss is more than compensated by the welfare gain caused by an exchange on a different bidding-zone border (often a congested one), that becomes possible only thanks to the counterintuitive one. This “congestion-relieving” effect makes sense if we keep in mind that the objective of the pan-European market coupling algorithm is to maximise the sum of consumer surplus, producer surplus, and congestion income in the whole European market.
If this sounds complicated and quite theoretical, that’s because it is. It is difficult to pinpoint exactly why a counterintuitive flow occurs in any situation with more than 4-5 bidding zones - except for the case of explicit auctions, where the counterintuitive flows are a result of inefficient allocation of cross-zonal capacities. Additionally, it can be difficult to disentangle the effect of allocation constraints and flow-based market coupling. One good example of counterintuitive flows (including calculations) with only three bidding zones can be found at Section 4.6.2 of the Princess Elisabeth Zone public consultation (link, page 137).

Looking at the figure above, it is hard to pinpoint the exact root cause of these counterintuitive flows. One high-level explanation could be that, for the Eastern part, the welfare gain of the (intuitive) flow from RO to HU outweighs the losses of the following (counterintuitive) flows out of HU to the neighbouring bidding zones. On the Central-Western side, a similar argument can be made for the (intuitive) flow from FR to IT NORD, supported by the (counterintuitive) flows into FR from BE, DE.
I will analyse the MTU in the figure above in more detail in Section 2.
4. Ramping constraints: Ramping constraints limit the power flow difference between consecutive MTUs, and they are typically applied on HVDC interconnectors. When these are allocated within SDAC, ramping constraints can cause counterintuitive flows as visualized in the picture below. (Thanks to Yves Langer for pointing this out.)

Figure 6: Counterintuitive flow caused by ramping constraint. Left: Commercial schedule. Right: Flow after taking into account ramping constraints. During the hatched MTU, the requested and final flows are in opposite directions.
Summary
- Counterintuitive flows are (net) scheduled commercial exchanges from bidding zones with high prices to bidding zones with lower prices
- They can take place for several reasons:
- Explicit allocation of cross-zonal capacity
- Allocation constraints to imports/exports
- Flow-based market coupling
- Ramping constraints
2. Intuitive and Counterintuitive flows
Market coupling at its best
Before delving into counterintuitive flows, let’s look at when things are “ideal”, i.e. when lines are not congested and full price convergence is achieved. Coordinated capacity calculation and market coupling (SDAC) ensures wholesale prices converge across all bidding zones. Note: never having congestions is not the aim, as it would require a large amount of transmission capacity – costly to build (and maintain) – to go unused most of the time, to ensure that hours of peak demand are not congested.
In 2023, this full price-convergence scenario happened in December, when only Ireland (because it is not anymore/yet physically connected to the rest of SDAC) and Switzerland (because of the explicit allocation mentioned in Section 1) had a slightly higher price. Every bidding zone border not involving CH had a price spread equal to exactly zero!

Figure 7: On the 5th of December 2023 at 20:00 CET, price spreads were 0 on all bidding zone borders excluding those involving CH (where spreads were only 0.6 €/MW). Prices are in €/MWh, and scheduled commercial flows are indicated by arrows, with size proportional to the flow. Note that Ireland was not physically connected to the rest of Europe during this MTU.
Intuitive flows, but congested
Usually, commercial exchanges occur from a low price to a high price area. However, the cross-zonal capacity is insufficient to achieve full-price convergence, such that the electricity prices in the two bidding zones differ. This is what we call congestion (market congestion, to be exact). We will see in Section 3 that, overall, the “congested” status is the most common one in SDAC.
The moment in which most bidding zone borders were congested at the same time in 2023 was 22/02/2023 at 14:00 CET when 47 borders (out of 67) were congested (see figure below).
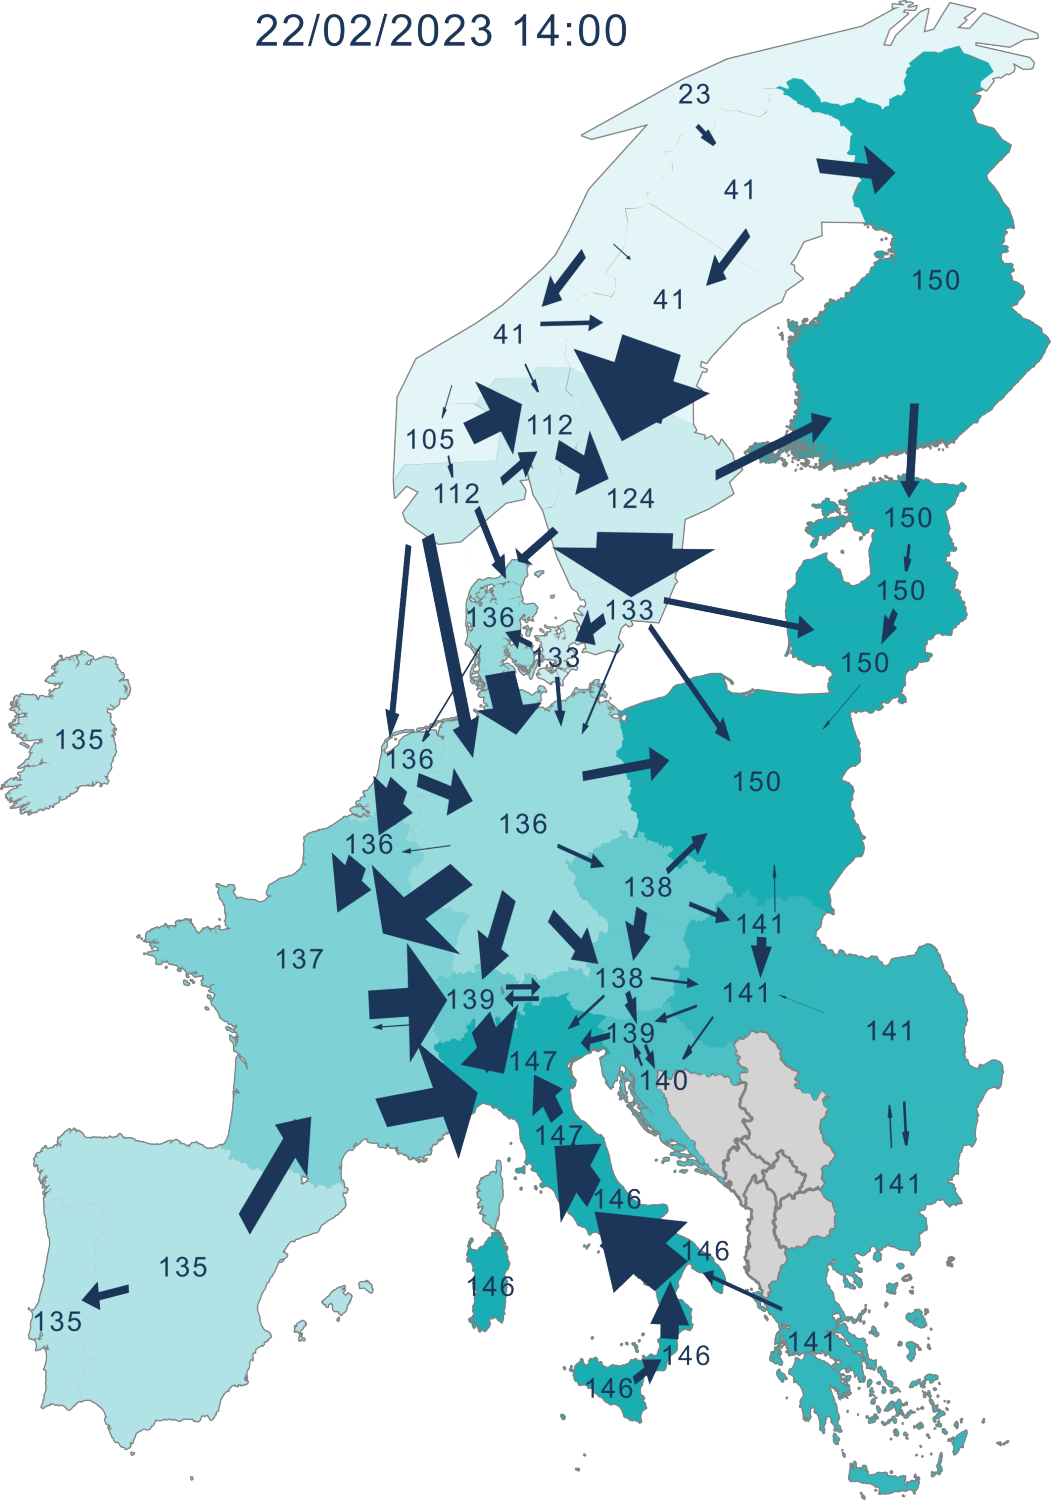
On this occasion, the non-congested bidding zone borders were all those of Baltic and SEE CCRs. All bidding zone borders in Italy North CCR and many in Nordic CCRs were congested (these trends will be further analysed in Section 3). In Core CCR, many adjacent bidding zones did not reach price convergence, which does not automatically imply congestion since flow-based capacity calculation is applied in Core1. This is a very good reason why having a coordinated (flow-based) process for capacity calculation, which can use the available transmission capacity as effectively as possible, is necessary.
Why?
Coordinated flow-based capacity calculation was introduced in 2015 (in Central Western Europe – FR, BE, NL, DE, AT). Before that, to ensure the operational security of the system, each TSO would have to be conservative about how much transmission capacity to offer bilaterally on each bidding zone border. This would systematically result in considerable unused and unavailable cross-zonal capacity. A coordinated capacity calculation methodology is a great efficiency improvement compared to bilateral agreements between two adjacent TSOs on how much capacity they can make available for cross-zonal trade.
A few steps would ensure even more efficient use of the scarce cross-zonal transmission capacity:
- Using a flow-based capacity calculation process (rather than NTC-based). This is used in Core CCR since June 2022 (see my previous post about this here), and is expected to be implemented in Nordic CCR in 2024. This is particularly important for regions where the grid is highly meshed.
- Enlarging the perimeter of CCRs. One step in this direction is the establishment of a new CCR which constitutes the merger of Core CCR and Italy North CCR, mandated by ACER decision 04/2024 (link). It is very likely that Switzerland will also participate operationally in the day-ahead capacity calculation process (but not be part of the CCR, formally), as its grid is strongly interlinked with those of the neighbouring bidding zones (AT, DE, FR, NORD), Currently, the expected timeframe for the implementation of this process is 2027. Additionally, the same ACER decision should assign the bidding zone border FR-SEM2 to Core CCR, valid from when the Celtic Interconnector will physically reconnect Ireland to SDAC (expected end of 2026).
- Improving the capacity calculation methodology at the external borders of CCRs that apply flow-based. One step in this direction is the implementation of Advanced Hybrid Coupling on the external borders of Core CCR, expected for 2025 (link). The Nordic flow-based capacity calculation is planned to go-live with Advanced Hybrid Coupling from the start.
- Although not directly involving capacity calculation, increasing the geographic scope of market coupling would also improve the efficient usage of the scarce cross-zonal transmission capacity. There are ongoing efforts to extend SDAC to the Energy Community (link), which includes countries in the West Balkans (Albania, Bosnia and Herzegovina, Kosovo, North Macedonia, Montenegro, Serbia) and Black Sea region (Georgia, Moldova, Ukraine). Including Switzerland and UK in SDAC would also reduce the occurrence of counterintuitive flows on the respective bidding zone borders, as the inefficiency of explicit auctions would be alleviated.
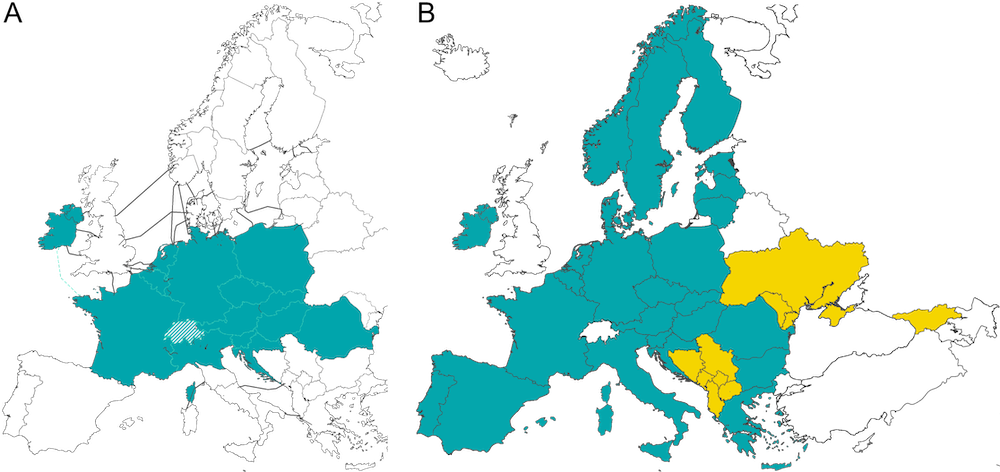
Figure 9: Geographical scope of A) Central Europe CCR (CH is not part of the CCR, but will cooperate on relevant processes such as day-ahead capacity calculation) and B) SDAC, with in yellow the countries part of the Energy Community.
Counterintuitive flows
Let us finally look at MTU with several counterintuitive exchanges, choosing the hour with the most counterintuitive flows of the year, 11:00 CET on 09/07/2023. For that hour, 19 bidding zone borders had counterintuitive (net) commercial exchanges in the day-ahead market.
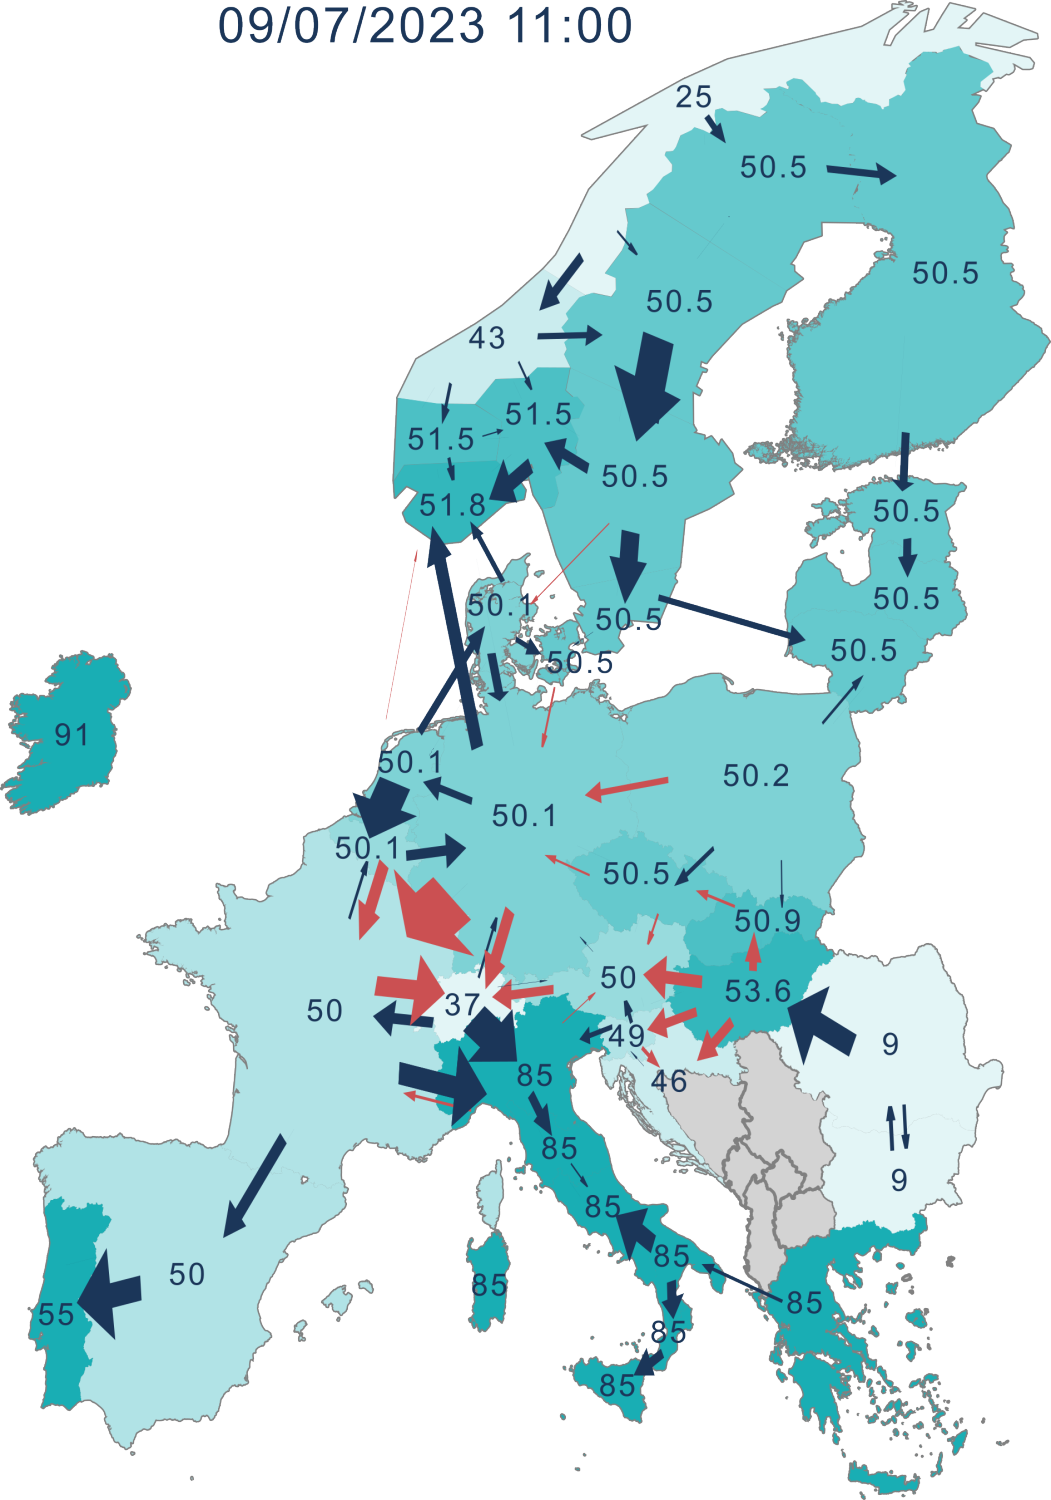
Figure 10: On the 9th of July 2023 at 11:00 CET, nineteen bidding zone borders had counterintuitive commercial flows (red arrows). Labels show day-ahead prices (€/MWh). Arrows represent commercial exchanges, with size proportional to the flow magnitude.
A few observations:
- Counterintuitive flows don’t affect the radial areas (i.e. where bidding zones are connected “in a row”). Examples of this are SWE, SEE, Baltic, and GRIT CCRs (see first figure for a reminder of the various CCRs). We will see in Section 3 that this situation is quite common
- CH shows counterintuitive flows because of the explicit allocation described in Section 1
- Hansa, Nordic and Italy North CCR show a few counterintuitive flows, but these are rather small (50-200 MW). These will be explained in detail in Section 3. The main reasons are ramping constraints on HVDC interconnectors, and allocation constraints
- Core CCR shows several counterintuitive flows (i.e. on 11 bidding zone borders out of 19). Why? Hard to say exactly, but two reasons are most likely:
- The price spread on the HU-RO border is so large that it is convenient to import from RO as much as possible, even though this means re-exporting from HU against the price differential. There is an overall welfare gain because the loss (HU exports times the price spread, per border: 1225x3.6 + 887x4.6 + 892x7.6 + 746x2.7 ~ 17284) is lower than the gain (exchange from RO to HU times the price spread: 2202x44.6 ~98209)
- The price difference on the FR-NORD bidding zone border is very large compared to the FR-BE and FR-DE borders. Therefore, it makes sense to have power flow counterintuitively into FR, in order to be able to re-export it to NORD with an overall welfare gain.
Analysis of 2023 market data
Let’s look at the yearly aggregated data and try to recognize some of the results we have already seen in the situations described in section 2.
Note: for ease of understanding, I will use four labels to describe the market outcomes
- Price convergence: Zero price spread, with commercial exchanges
- Congested: Non-zero price spread, with commercial exchanges in the intuitive direction
- Counterintuitive: Non-zero price spread, with commercial exchanges in the counterintuitive direction
- Outage: Non-zero price spread, without any commercial exchange. Please note that this is compatible with an outage, but it does not necessarily mean that there was an actual outage, there might be more complex reasons at play.
We can distinguish the European market in regions with similar grid topology and the nature of the allocation regime:
- Explicit allocation in a meshed grid – Switzerland
- Price-coupled NTC in radial regions - SWE, SEE, Baltic, GRIT CCRs
- Price-coupled meshed grid with flow-based allocation – Core CCR
- Price-coupled NTC with lineset constraints - Nordic and Hansa CCRs
- Price-coupled NTC with allocation constraint - Italy North CCR
Explicit Allocation - CH

As introduced earlier, explicit allocation almost always results in suboptimal allocation of cross-zonal transmission capacity, because usually some capacity is allocated and nominated in both directions on a bidding zone border. In the figure above we see that the Swiss borders never reached price convergence in 2023. This is likely because the explicit auctions take place earlier in the day than SDAC and the energy clearing price is set for CH at 11:00 CET (closing time of the Swiss auction on EPEX), while the neighbouring bidding zones take part in SDAC one-hour later.
The Swiss borders were congested during 70-80% of the MTUs, while counterintuitive flows were observed 15-30% of the time. As seen in Section 2, counterintuitive flows with explicit allocation occur because traders “bet” on the day-ahead prices in the relevant adjacent zones, and sometimes they get it wrong. The CH-NORD border shows fewer instances of counterintuitive flows because, historically, Italy Nord has been a net importer, such that the CH-NORD border is easier to forecast. Additionally, NORD is (not yet) part of a flow-based region, where prices are strongly linked across bidding zones, making price forecasts generally difficult.
Price-coupled NTC in radial regions

Price-coupled radial regions (SWE, SEE, Baltic, GRIT) typically show intuitive flows (i.e. either with “price-convergence”, or “congested”), with the exception of LT-PL, most likely due to the Polish Allocation Constraints (see Section 1 for an explanation). Of these bidding zone borders, ES-FR, GR-SUD, EE-FI, LT-SE4 and LT-PL show price convergence during 30-40% of MTUs and 45-60% of MTUs with congestions, while the remaining borders show price convergence in almost 95% of the time.
We also see “outages” (either planned or unplanned) on the HVDC interconnectors between GR-SUD, PL-LT, LT-SE4
The very few instances of counterintuitive flows on GR-SUD are most likely due to ramping constraints.
Price-coupled meshed grid with flow-based allocation – Core CCR

The electricity grid in Core CCR is highly meshed. We can see that:
- Price convergence occurs approximately 30% of the time on all bidding zone borders (excluding the Polish Core bidding zone borders, where these occur ~15% of the time, again due to the Polish allocation constraint)
- Congestions occur during ~40-60% of the MTUs. The border most often congested in 2023 was DE/LU-PL, followed by BE-DE/LU, with respectively ~62% and ~60% of congested MTUs
- Counterintuitive flows occur ~10-40% of the time. The least counterintuitive borders were the German borders: DE/LU – BE, AT, NL, FR with respectively ~7%, 14%, 16%, 16%. The most counterintuitive ones were PL-SK, PL-CZ, HU-HR, and HU-SK with respectively ~40%, 34%, 33%, 31%. Again, the Polish allocation constraints are the likely cause for (at least) the first two of these. Note: The outcomes of flow-based capacity calculation (applied in Core CCR) are prices and net positions, while commercial flows result from calculations based on SDAC scheduled exchange methodology. Therefore, while “price-convergence” is well-defined, counterintuitive vs congestions are not. Thanks, Joost Greunsven for pointing this out.
- The “outage” situation (defined as the absence of scheduled commercial flows with non-zero price difference) occurs mostly on the BE-DE/LU border since this is the only bidding zone border consisting solely of an HVDC interconnector.

Figure 13: Classification of day-ahead commercial schedules in Core CCR in 2023.
The bottom line is that most bidding zone borders in Core behave in a rather homogeneous way, except for the Polish borders.
Price-coupled NTC with line-set constraints - Nordic and Hansa CCR
In the Nordic and Hansa CCRs, the situation is somewhat in between the Core and radial areas, including the influence of constraints (i.e. the line sets introduced in Section 1). The grid in the Nordic synchronous area is fairly meshed, however the electricity flow tends to be from north to south (where population density and load are higher).
Counterintuitive flows occur on a few borders, all involving bidding zones that apply line-set constraints. Note: DK1-NO2, NO1-NO3, NO1-SE3, and NO3-NO5 do not have line-set constraints on the border itself, but at least one of the pair of bidding zones involved does apply line-set constraints (on other borders). Counterintuitive flows occur 5-15% of MTUs. As several of these borders consist of HVDC cables, ramping constraints can also cause counterintuitive flows, as explained above for the GR-SUD bidding zone border.
Regarding intuitive flows, borders involving HVDC interconnectors tend to be more congested than AC ones. Beyond this, it is hard to find relevant trends, as borders like SE1-SE2 show price convergence during nearly 100% of MTUs, and borders like NO1-NO3 show congestion at ~ 70% of MTUs and ~15% of price convergence. Geographically, congestions seem to materialize more often around more densely populated areas (i.e. DK1, DK2, NO1, NO2, SE3, SE4).

All bidding-zone borders with HVDC interconnectors show outages (which are often planned, for maintenance). Note: DE/LU-DK1 and DE/LU-DK2 both have an AC component. However, outages occur on AC borders too (e.g. NO1-NO3, NO1-SE3, NO3-NO5, NO4-SE2).
Price-coupled NTC with allocation constraint - Italy North CCR.

Italy North is, in some ways, a special CCR. The grid itself is rather meshed (17 cross-border connections between NORD and neighbouring bidding zones in the North, of which 9 with CH, 4 with FR, 2 with SI, 2 with AT). However, historically the flow of electricity has been towards Italy, so much so, that the capacity calculation methodology (CCM) of Italy North CCR is used to try and maximize imports into Italy explicitly. The “export corner” situation (i.e. NORD exporting on one bidding zone border, and importing on the others) used to be infrequent, while it is now considered in the CCM (and it should go live in Q2 2024). Additionally, Italy North applies allocation constraints on its northern borders.
The combination of these factors results in mostly congested borders (~75-80% of MTUs), with up to 5% of MTUs showing counterintuitive flows. The remaining MTUs are split between price convergence and outage, with the latter being more common on the AT-NORD border (during 2023 mostly composed of a single network element).
Because the grid in this region is meshed, Italy North CCR and Core CCR will merge into a single CCR (Central Europe) that applies the flow-based method for capacity calculation, following ACER decision 04/2024 of 19/03/2024 (link).
Summary
- Explicit auctions foster inefficient allocation of cross-zonal capacity and make it very difficult to reach price convergence.
- Regions where the grid is (mostly) radial (SEE, SWE, Baltic, GRIT) typically show good price convergence and almost absent counterintuitive flows.
- Regions that apply flow-based capacity calculation (so far only Core CCR) show a remarkably homogeneous behaviour (excluding Poland) with price convergence during ~1/3 of the MTUs. Counterintuitive flows occur in Core CCR between 10-40% of the time, however in Core commercial schedules are calculated after the clearing prices and net positions are determined.
- Hansa and Nordic CCR show rather inconsistent behaviour among their bidding zone borders. Generally, borders composed entirely of HVDC interconnectors tend to be congested, and bidding zones applying lineset constraints tend to cause counterintuitive flows on their borders.
- The bidding zone borders part of Italy North CCR are congested during 75-80% of the MTUs
Industry Topics
Market Integration, Flow-Based Capacity Calculation, Counter-Intuitive Flows
Services
Regulatory & Energy Analysis, Technical Advisory